
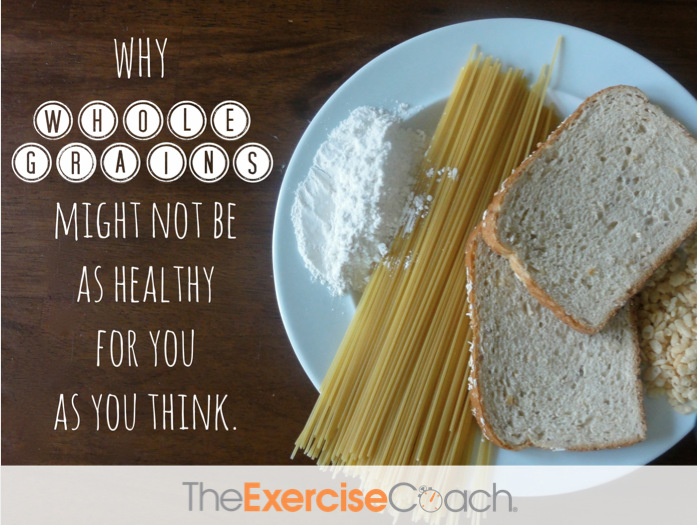
Our grain series continues today with our discussion of the Glycemic Index, Glycemic Load, and what this all means in relationship to grain consumption. Before jumping into today’s article, you may want to read our series introductory post Why Whole Grains May Not Be As Healthy For You As You Think and Part 2: It’s As Simple As Sugar.
Understanding the Glycemic Load
No series on grain avoidance would be complete without a discussion of The Glycemic Load (GL). When I left off on the last post, I gave a basic explanation of the carbohydrate values in grains and explained that sugars ultimately were a big reason one might want to reduce or eliminate grains from their diet. As explained, the carbs (sugars) cause blood sugar surges and insulin responses that over time, wreak havoc on the body. Because of this process, interest in The Glycemic Index (GI) has skyrocketed! It seems everyone interested in stabilizing their blood sugar is looking to this index to make food choices. As such, we have seen a surge in people eating honey or agave nectar thinking it was “good” for them since it was lower on the GI than sugar. And, we see people neglecting to eat bananas or carrots because they have a high GI index rating! As you can probably tell, this way of eating means that some people are avoiding healthy, nutritious foods and eating foods that are simply “kinder” alternatives to table sugar!
GLYCEMIC INDEX – A basic understanding
Before we can understand the difference between the Glycemic Index (GI) and the Glycemic Load (GL) (and why I think the GL is of far more importance practically speaking), it is important to understand the GI. Simply put, the GI ranks carbohydrates on a scale of 1 to 100 based upon the rate of how 50 grams of that food affects your blood sugar levels (i.e. how rapidly they are digested and absorbed, thus affecting blood sugar fluctuation). Lower GI foods will digest slowly and require only gradual rises in blood sugar and insulin. High GI foods digest quickly and will cause rapid increases in blood sugar and insulin. A GI of 1-55 is considered low, 56-69 is considered medium, and 70-100 is high. 50 grams of glucose is ranked at 100. There are many published charts which give you the GI for common carbohydrates. This chart gives the glycemic information for a great variety of foods, and this one gives information on grains and cereals.
GI, however, is not a measure of “how much” of that food you are eating. When the GI is determined, all foods tested are given in the same quantities (50 grams). Thus, if you had just a tiny amount of a “high” GI food, the actual affect on your blood sugar may not be as great as a large amount of a medium GI Food. For example, if you came home really hungry – you might indulge in a large bowl of pasta (which has a high GI Index rating). Yet, you probably would not indulge in the same size bowl of pineapple or beetroot (which has a high GI Index rating). We typically eat these types of foods in lower quantities.
Introducing the Glycemic Load
This practical fact spawned the development of another measure for blood sugar affect called The Glycemic Load. The GL is calculated by multiplying it’s GI by the amount of carbohydrate (sugar and starch) contained in a standard portion size. That amount is then divided by 100. Simply put – the Glycemic Load will tell you the affect on blood sugar based on a common portion size of that food. GL’s of 10 or below are low, 20 or below are medium and over 20 are high. For example, watermellon has a GI of 72 (High). Yet, it’s Glycemic Load based upon a 1 cup portion size, is only 8 (LOW). An equal 1 cup serving of “healthy” whole grain brown rice has a GI of 55 (medium) and a GL of 23 (High).
The bottom line is, both measures are good but the Glycemic Load will tell give you more data on the affect of that food based on the amount you would actually eat vs. the affect based on a fixed quantity of every food item on the index. If we looked only at GI to choose foods, we wouldn’t even choose to eat the carrots, for example, since they are relatively high on index! Yet, in reality, the small quantity we would eat would have nominal affect on our blood sugar but a great affect based on the nutrients contained. Looking only to the GI, we may even justify choosing peanut M-N-M’s which have a lower (33) GI index rating over many healthy, nutrient dense foods! I’m guessing we all can agree that the candy would not be the better choice.
What this all means for Grains
When it comes to grains, we can see from the GI and GL charts that grains simply are a medium to high GI and GL choice. Anything made from processed grains (breads, pasta’s, cereals, baked good, etc. are all high and we typically over-indulge making our serving size (and GL Load) extremely high. But even when we look at the grain itself (1 cup of brown rice, barley, buckwheat, millet, bulgar, corn) you can see that the GI and the GL are still medium to high. Bottom line — eating grains regularly will unfortunately cause the detrimental affect on blood sugar described in the previous post.
Read the rest of this series:
Why “Whole” Grains May Not Be As Healthy For You As You Think: Series Introduction
Part 2: It’s As Simple As Sugar
Part 3: Understanding the Glycemic Load